

▶ Film · 8 sec
WorkWeb experience & visual identity
fromearth / 2050
Your world.
Seen differently.
An interactive globe to explore the future through the places we know.
Explore the project ↓01 — Motion studies
▶ Film · 8 sec
A constellation of places
The globe reduced to points. Geography becomes a rhythm.▶ Film · 8 sec
A language of signs
The smallest marks carry the movement.▶ Film · 8 sec
Time, made tangible
A number, a ruler, a quiet sense of progression.▶ Film · 8 sec
Through a different lens
Glass and geography. A little distortion reveals a little more.02 — Interactive studies
↔ InteractiveMove over the letters · Hold to leave heat · Or use Space
Leave your mark.
↔ InteractiveDrag to rotate · Scroll to zoom · Or use the controls
A different perspective.
↔ InteractiveDrag the ruler · Or use the arrow keys
Feel time move.
↔ InteractiveMove over the type to bend it · Or use the arrow keys
Look closer.
03 — Visual identity
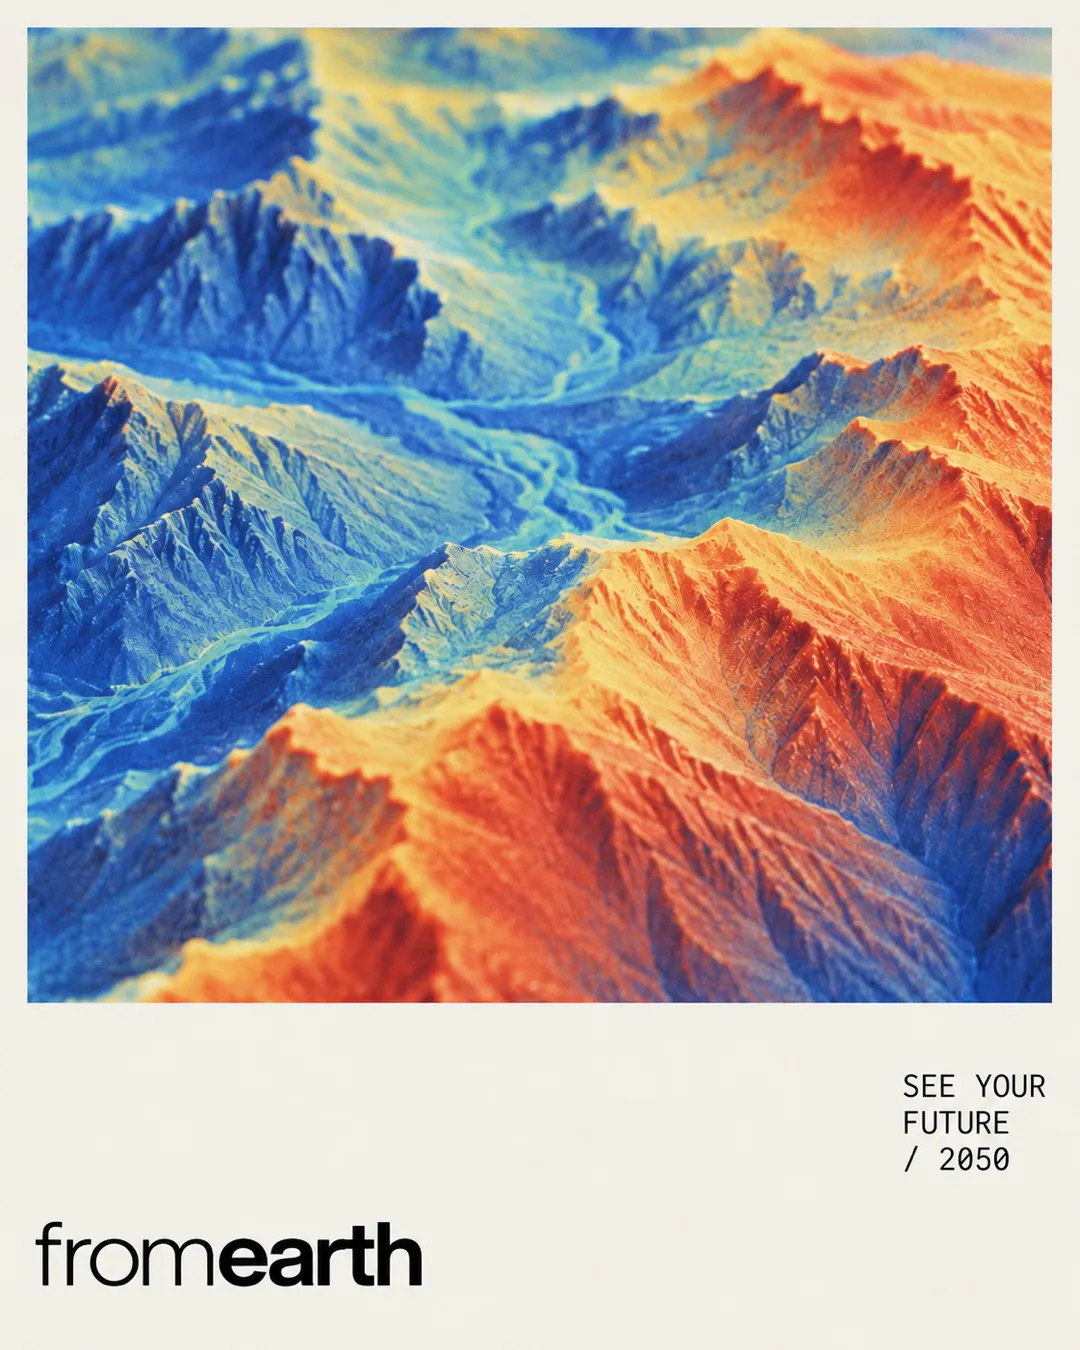
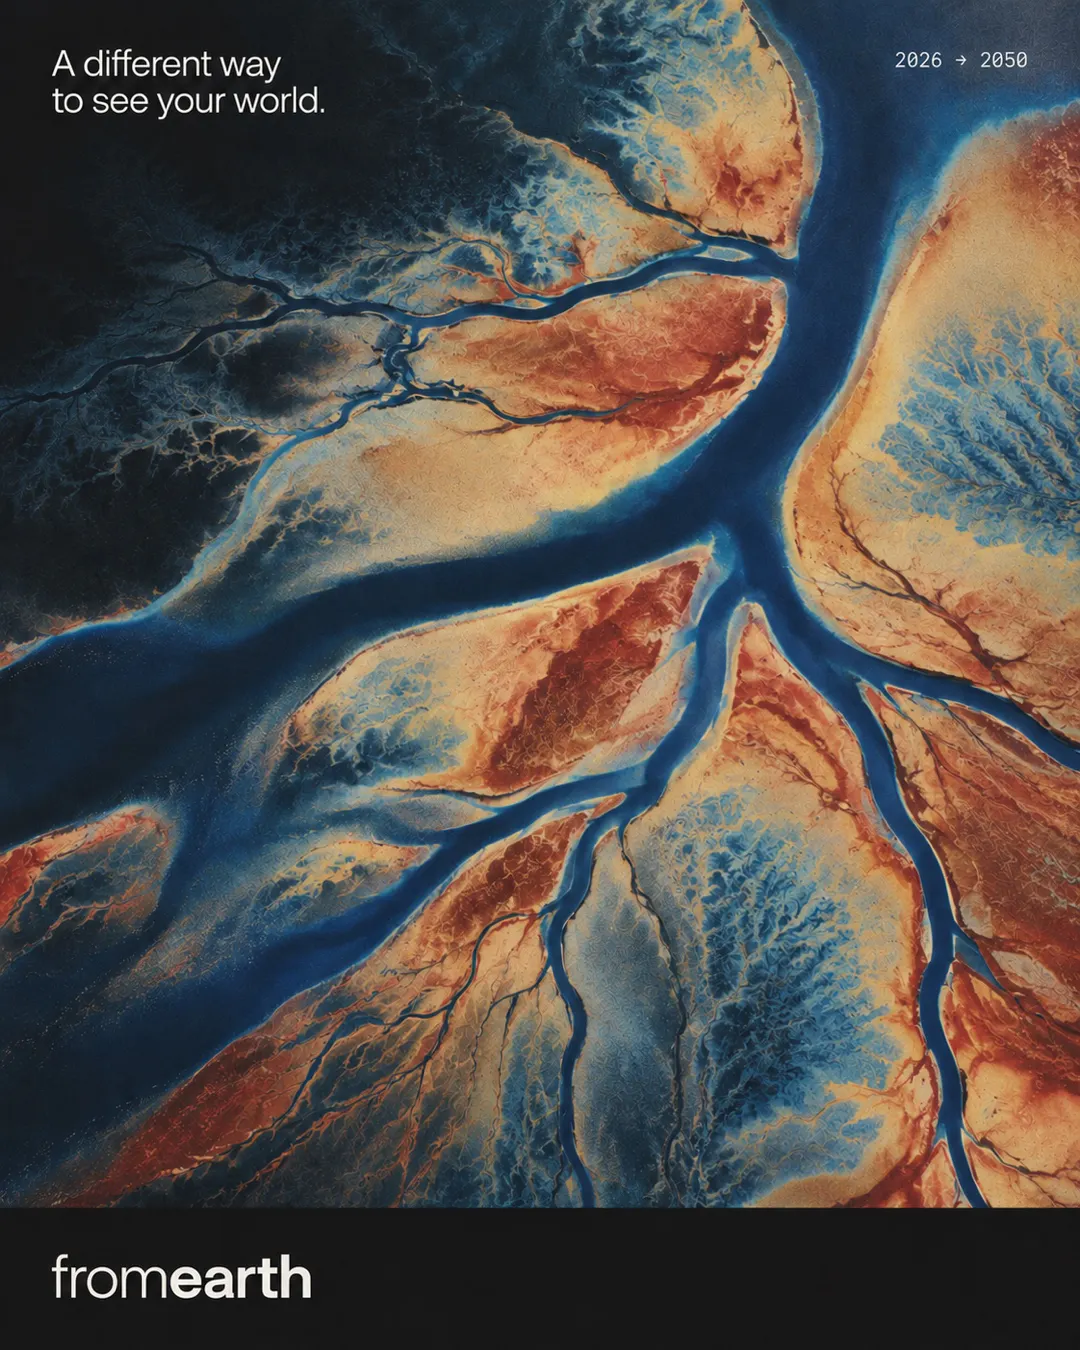
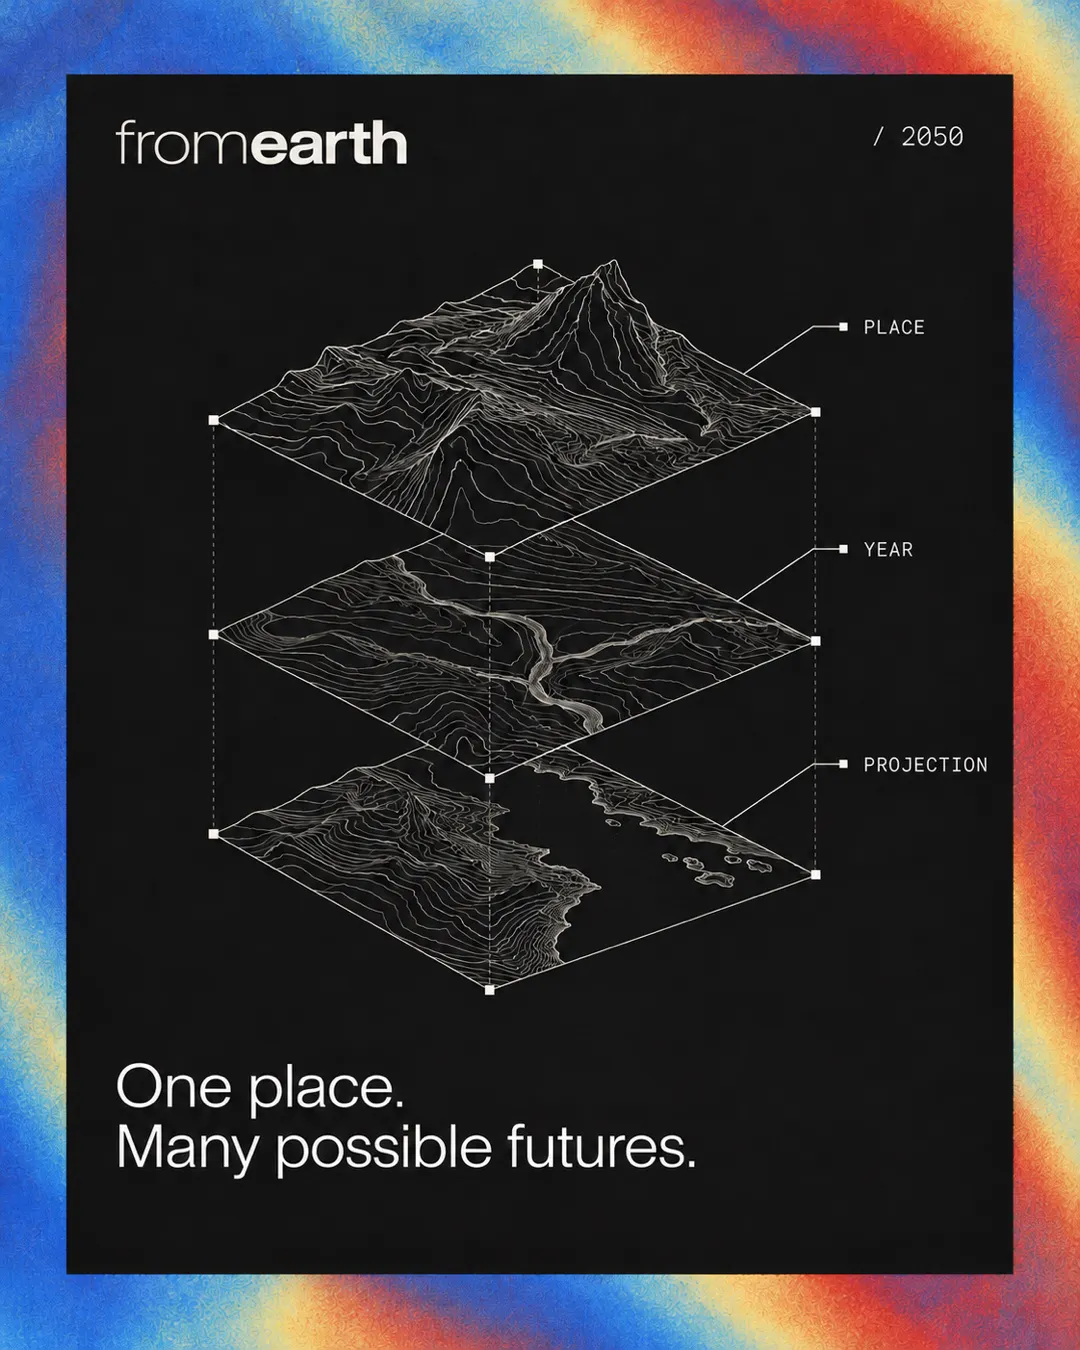
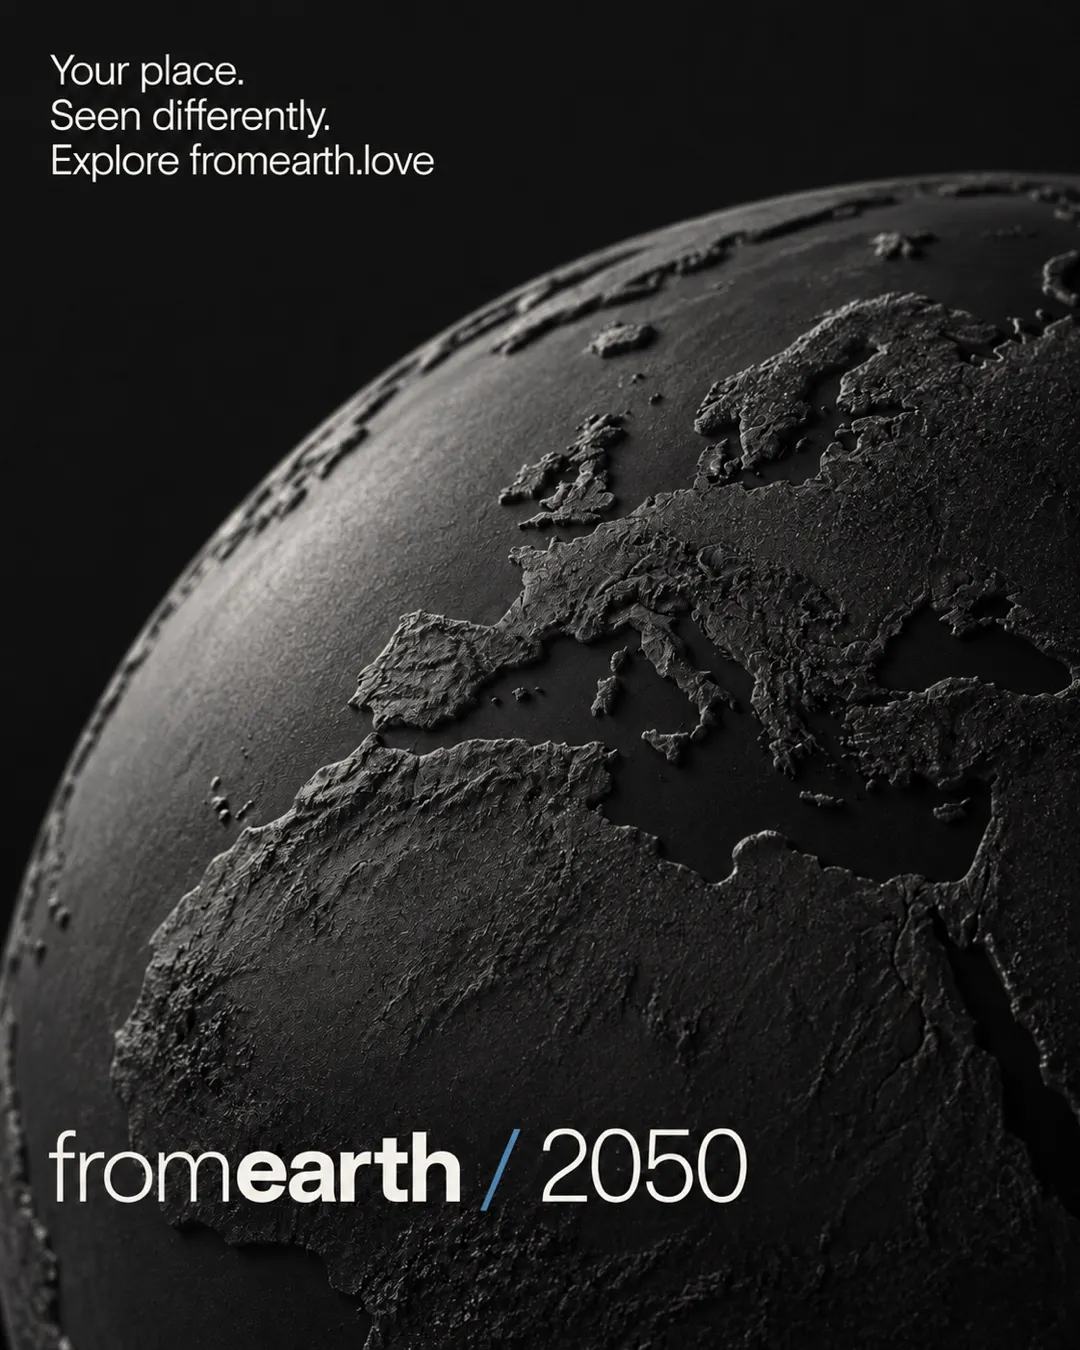
Project information
fromearth / 2050 is a free browser experience for exploring climate projections through the places we know. Search for a city, turn the globe, move from 2026 towards 2050, or compare two places side by side.
Climate change is often described through global averages and distant horizons. This project begins with somewhere familiar: the city you live in, a place you grew up, somewhere you love. An invitation to explore a complex subject, with access to the sources and definitions behind it.
The visual language pairs a restrained interface with tactile imagery and motion. Thermal landscapes, layered contours and a graphite Earth extend the experience into a campaign. These illustrations are distinct from the live climate data.
The four interactive studies above isolate the identity, globe, time control and refracting lens. They give each gesture room to be experienced on its own; climate indicators and comparisons are available on the full website.
- Idea
- Robin M.
- Created by
- fromanother ↗
- Format
- Interactive web
- Project overview
- Press sheet · PDF ↗
- Descriptions & credits
- Press text · TXT ↗